Problem Statement
In 1978, Warren McClesky, a black man, was sentenced to death after killing a white police officer in Georgia . McClesky appealed to the Supreme Court stating that the death penalty was racially biased. McClesky presented the data of all homicide convictions in the state of Florida between 1976 and 1980 in which the suspect was black or white and the victim was black or white. However, the court ruled 5-4 that the data made no difference in the sentencing issues. The prosecution then used an alleged admission from an informant planted by the police stating that McClesky was the triggerman. The court then found McClesky guilty. McClesky was then put to death by the electric chair. My job as a student was to look at the data presented and find out whether or not the homicide convictions were racially biased.
My Process
The first thing I looked at was the overall data. I noticed that 11.2% of white people receive the death penalty, while 8.5% of black people get the death penalty. I then looked at the two subcategories of the race of the victim and was astonished at the results. When I looked at the white victim data, I found that around 19.3% of blacks accused were given the death penalty, while whites had a 12.3% death ratio. Almost 1/5 of the blacks accused were given the death penalty. Next, I looked at the black victim data. I was dumbfounded to find out that none of the white suspects tried were given the death penalty, while 1.3% of blacks that were tried were given the death penalty. After looking at the data in a new perspective, I have concluded that the Supreme Court in Florida was racially biased in its sentencing.
The Process that Other People Used
The process that my peers used to solve this problem was very similar to how I handled it. They first looked at the data and compared it to the percentage of white and black people who get the death penalty. They also found the data racially biased after finding out the individual victim data.
The Solution
When looking at the overall data, everyone will make the same assumption that white people are given the death penalty because the percentage is higher. However, when broken down into victim subcategories, the results dramatically change. When looking at the white victim data, there is a 7% percentage difference between the white and black suspects. In this case, it was the blacks who had the higher percentage. When looking at the black victim data, only 1.3% of blacks were given the death penalty, while no white suspects were given the death penalty. When comparing the two subcategories, you can see that the convictions were racially biased. In the black victim data, hardly anyone was given the death penalty, and if it was given, it was given to a black suspect. When we get to the white victim data, we can see everything change. We instantly see that 20% of blacks were given the death sentence compared to the 12% of whites. Compare these numbers to the black victim data, and anyone can see that this is racially biased.
Assessment of the Problem
I'll be honest. Overall, I found the problem very interesting to complete and see the results. Unfortunately, I felt that it was too easy for me and that it didn't require much math to solve. This problem was very fun to do but I felt that it wasn't challenging enough. When my group and I received the work sheet, we figured out the solution in under a minute. I did however, like the concept of the Simpson's Paradox and how it applies to this problem. The Simpson's data is a paradox itself. When two data sets are compared to find a common solution, one data set appears to be better than the other. When broken down into subcategories, the other set is factually better. This is the Simpson's Paradox. I really liked the concept of the paradox itself.
To further advance my knowledge of the Simpson's Paradox, I went online and searched for more examples. Most were generic explanations but some actually had interesting examples. Here is a website that stuck out to me.
Self Evaluation
Before I explain what grade I should receive for this assignment, I would like to share with you one of my journal entries. This entry was written based on a question prompt. This prompt was "If I were given a set of data and was told to analyze it, what would I ask myself." I will now share my thoughts on the question.
*Is there any outliers in this data?
*What variables are being presented and for what reason?
*What am I looking for in the data presented?
*Is the data purposely misleading me to a conclusion?
*How many data values are in the data set I am looking at?
These were the questions I asked myself when I was solving the problem. When I was solving this problem, I put all of my effort to make sure my work was correct and without human error. I doubled checked my work and with my peers to make sure that our solutions were the same or similar. Only when I was satisfied with my work, I sat back and relaxed. For this reason, I believe that I should get an A+ for this assignment.
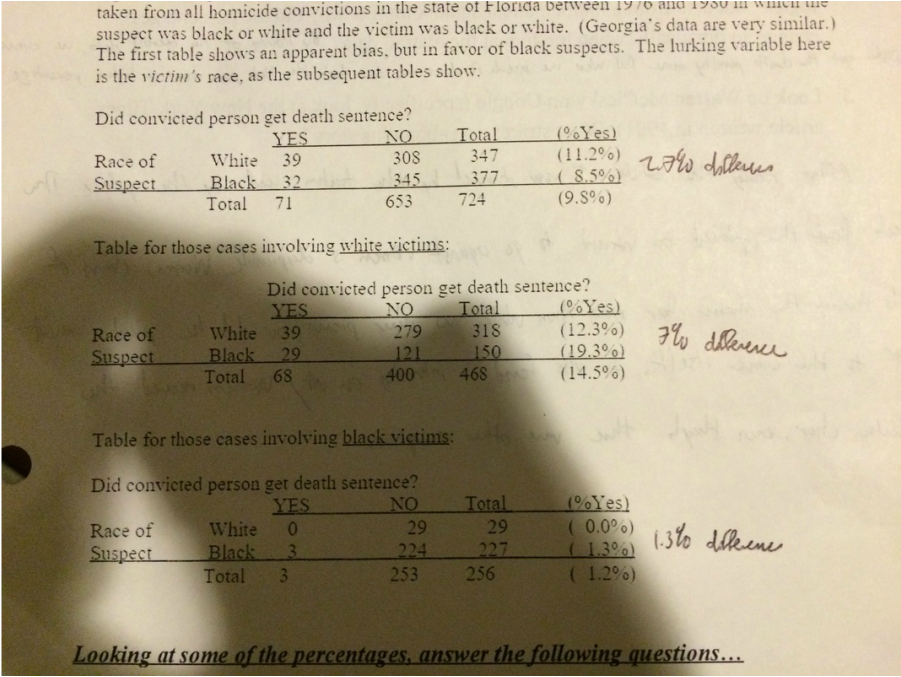
The data sets presented in the McClesky problem. (From top to bottom): Overall death sentences, Death sentences involving white victims, and death sentences involving black victims.
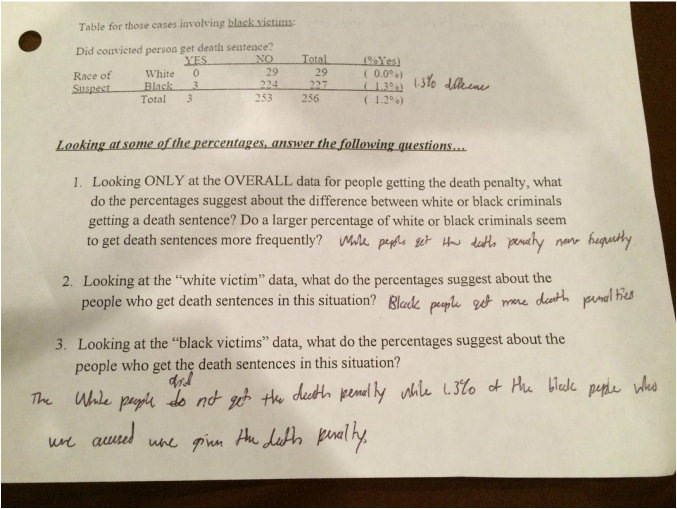
Questions presented at the end of the problem. These questions were used to make my peers and I analyze this problem in a deep and meaningful way.
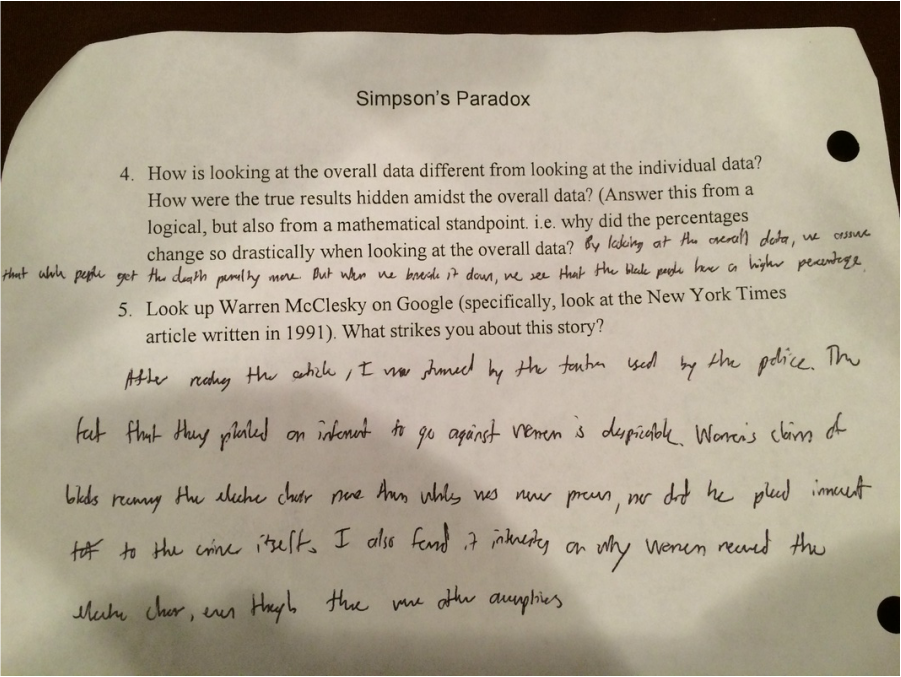
Continuation of questions.
 RSS Feed
